Last update:
Last week I wrote about getting Kubernetes cluster metrics with Prometheus. Metrics are only one part of the story. Logs are essential as well, and luckily we have a great set of tools that will help us to create simple and easy logging solution. In this post, I will show you how to start monitoring Kubernetes logs in 5 minutes with EFK stack (Elasticsearch, Fluent Bit, and Kibana) deployed with Helm and Elasticsearch operator.
Previous post
Just blogged: Get #Kubernetes Cluster Metrics with #Prometheus in 5 Minutes https://t.co/zhZBsGjpHl
— Alen Komljen (@alenkomljen) April 15, 2018
Fluentd vs. Fluent Bit
EFK stack usually refers to Elasticsearch, Fluentd and Kibana. However, I decided to go with Fluent Bit, which is much lighter and it has built-in Kubernetes support. Fluent Bit can read Kubernetes or Docker log files from the file system or through Systemd journal, enrich logs with Kubernetes metadata, deliver logs to third-party storage services like Elasticsearch, InfluxDB, HTTP, etc.
Fluent Bit is a Lightweight Data Forwarder for Fluentd. Fluent Bit is specifically designed for forwarding the data from the edge to Fluentd aggregators.
Using Fluent Bit doesn't mean that you cannot put Fluentd in the mix. For the sake of simplicity, I excluded it from this post. Here are some major differences between Fluentd and Fluent Bit from official FAQ page:
| - | Fluentd | Fluent Bit |
|---|---|---|
| Scope | Servers | Containers / Servers / Embedded Systems |
| Language | C & Ruby | C |
| Memory | ~40MB | ~450KB |
| Dependencies | Built as a Ruby Gem, it requires a certain number of gems and Ruby interpreter | Zero dependencies |
| Plugins | More than 650 plugins available | Around 30 plugins available |
| License | Apache License v2.0 | Apache License v2.0 |
Elasticsearch Operator
For logs storage, you need the Elasticsearch cluster. The best way to deploy stateful applications on Kubernetes is using operators. I mentioned them in almost every post related to stateful applications. Operators are the hot topic, and you should start using them. Thanks to CoreOS team we have some great operators like Prometheus, Etcd, and Vault.
Introducing the Vault Operator, an open source tool to streamline installing, managing, and maintaining instances of Vault on #Kubernetes https://t.co/xkwUr6TNfr
— CoreOS, Inc. (@coreos) April 19, 2018
You can check my blog post about Elasticsearch operator for more details. My preferred way to deploy applications on Kubernetes is using Helm. For this post, I created my Helm charts repository where I can put some charts when needed and to not wait for a pull request to get merged into official charts repository.
So, let's add the new Helm repository and install the Elasticsearch operator:
⚡ helm repo add akomljen-charts \
    https://raw.githubusercontent.com/komljen/helm-charts/master/charts/

⚡ helm install --name es-operator \
    --namespace logging \
    akomljen-charts/elasticsearch-operator

⚡ kubectl get pods -n logging
NAME                                                  READY     STATUS    RESTARTS   AGE
es-operator-elasticsearch-operator-568667668b-b6z2v   1/1       Running   0          33s
When you install the Elasticsearch operator, the new Custom Resource Definition or CRD gets created. You can check that with this command:
⚡ kubectl get CustomResourceDefinition
NAME                                         AGE
elasticsearchclusters.enterprises.upmc.com   2m
Glue Everything Together
So, how to glue all the components together? I created an umbrella Helm chart which combines multiple charts into one installation unit. It means that we have only one property file and one Helm package to install and run the whole EFK stack. You can check for default values file and adjust values for your environment. Let's install EFK chart:
⚡ helm install --name efk \
    --namespace logging \
    akomljen-charts/efk

⚡ kubectl get pods -n logging
NAME                                                  READY     STATUS    RESTARTS   AGE
efk-kibana-6cf88598b6-xlkv2                           1/1       Running   0          5m
es-client-efk-cluster-545d4ddb9-mp8d6                 1/1       Running   0          5m
es-data-efk-cluster-default-0                         1/1       Running   0          5m
es-master-efk-cluster-default-0                       1/1       Running   0          5m
es-operator-elasticsearch-operator-568667668b-b6z2v   1/1       Running   0          6m
fluent-bit-pglgq                                      1/1       Running   0          5m
After a few minutes, all services should be up and running. The Elasticsearch curator job is installed as well as a cron job:
⚡ kubectl get cronjob -n logging
NAME                        SCHEDULE    SUSPEND   ACTIVE   LAST SCHEDULE   AGE
efk-elasticsearch-curator   0 1 * * *   False     0        <none>          5m
This service purges old indices and keeps only 7 days of data by default.
To search for the logs, use kubectl port-forward command on Kibana pod to access it. Exposing Kibana with Ingress is a potential security risk because Kibana doesn't have any authentication method by default. Use Ingress only on test cluster or deploy oauth2-proxy for other authentication providers like GitHub or Google.
⚡ kubectl port-forward efk-kibana-6cf88598b6-xlkv2 5601 -n logging
Open your web browser at http://localhost:5601 and you should see the Kibana dashboard:
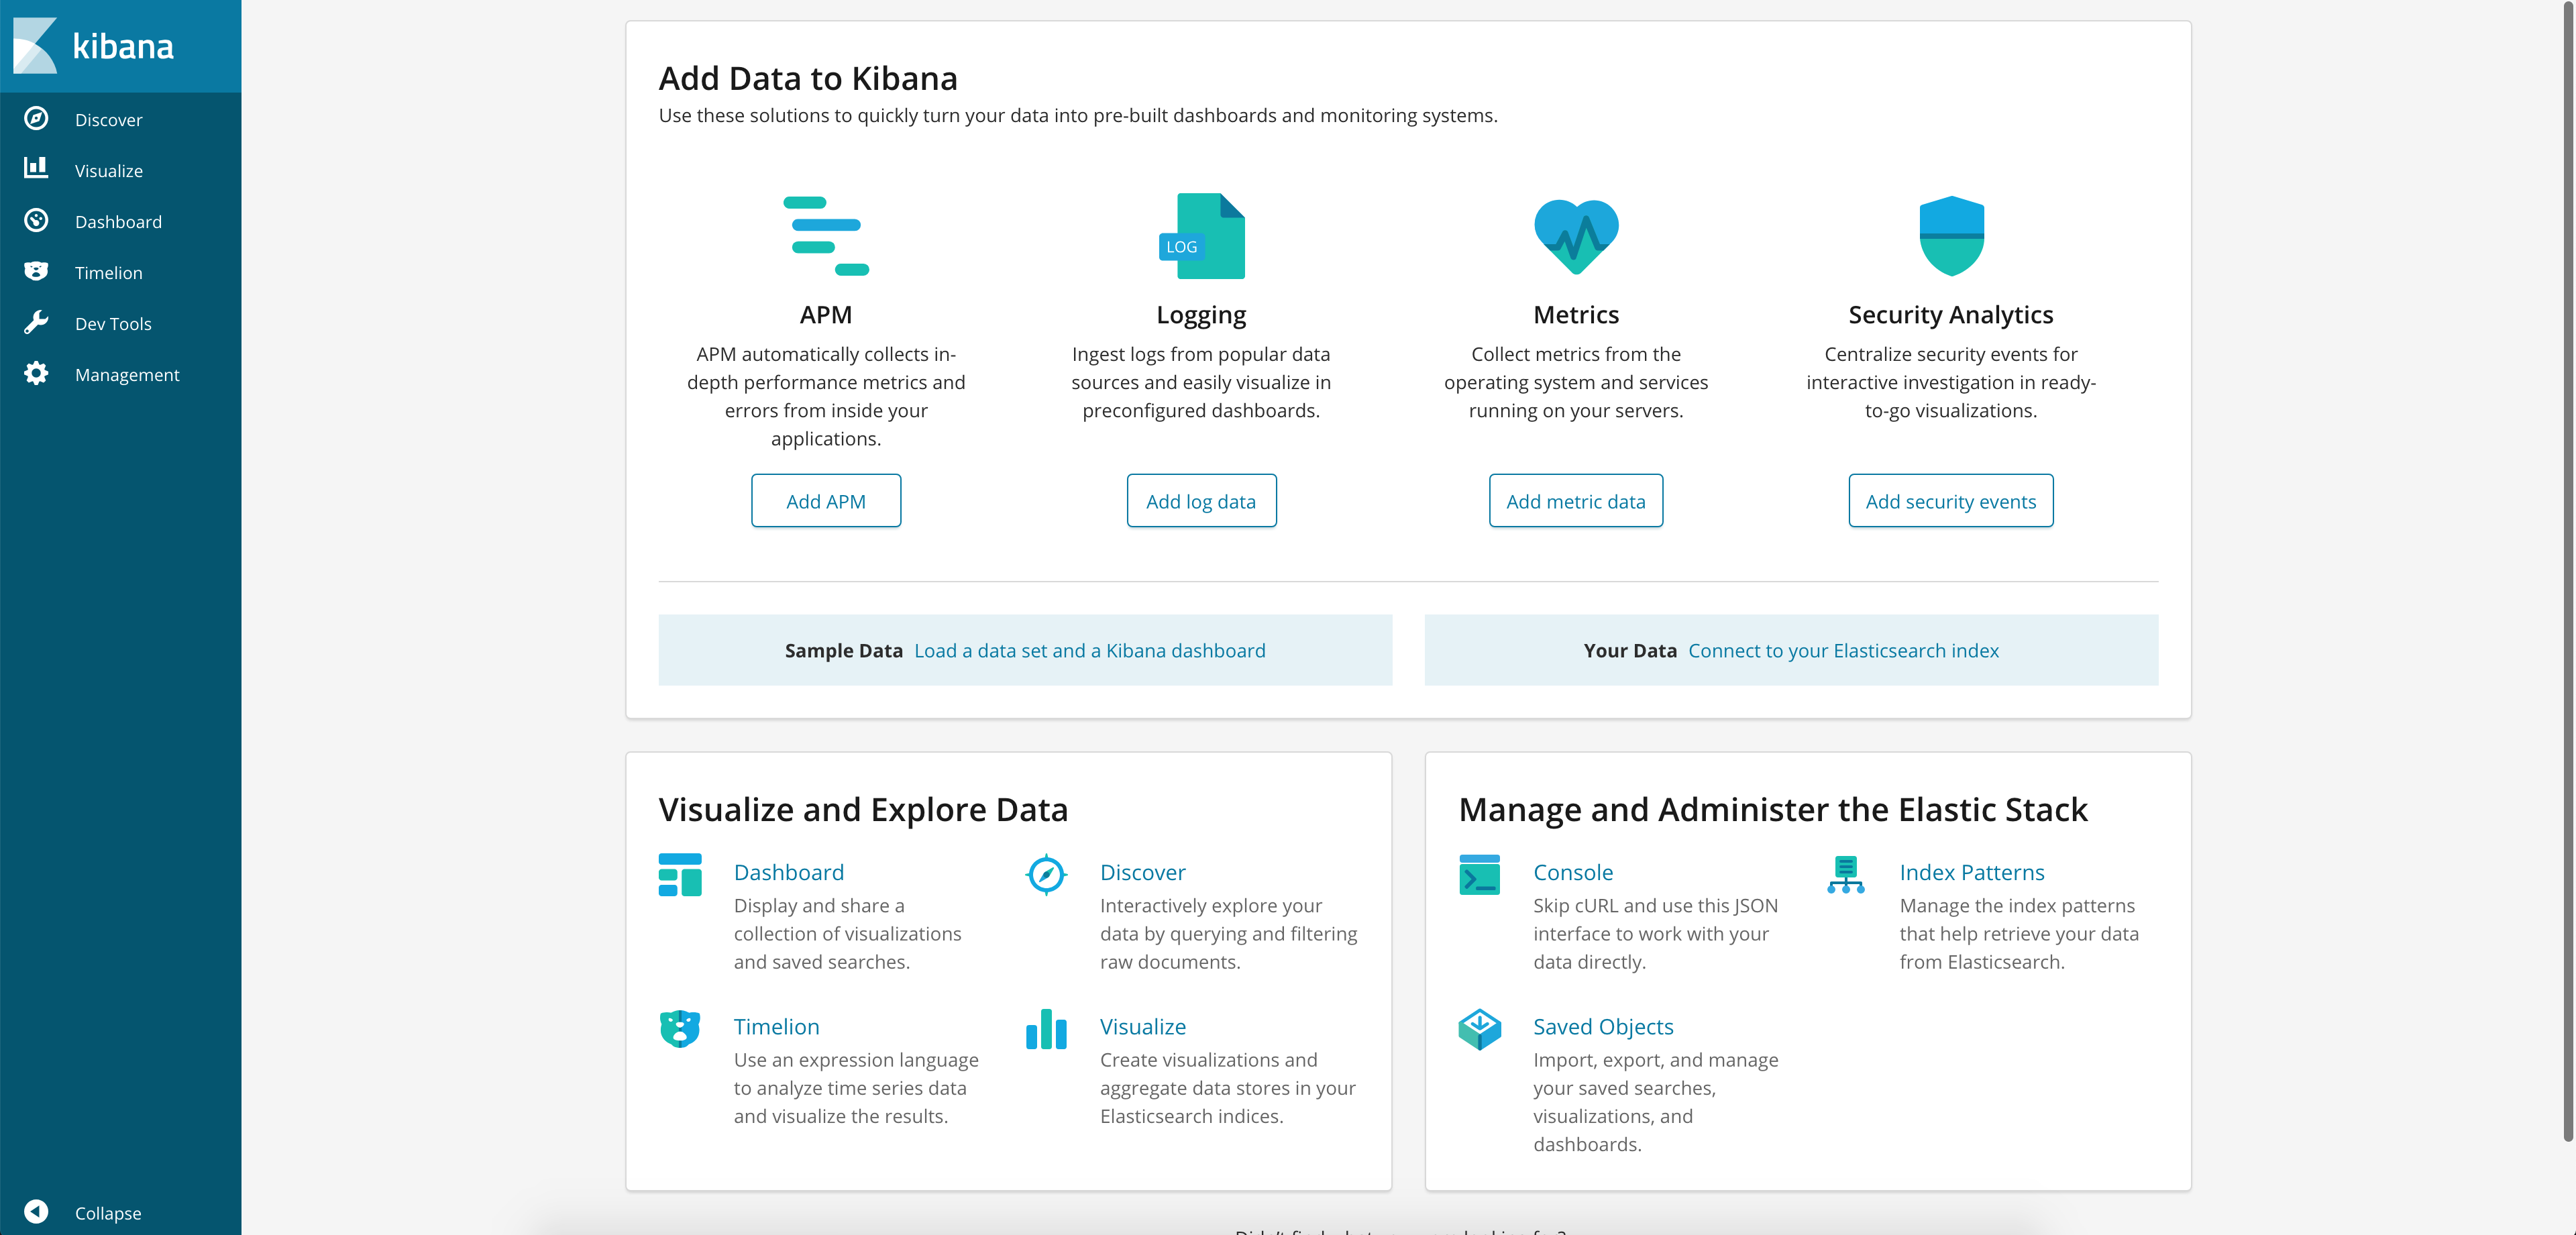
Then, go to Discover menu item, configure the index to kubernetes_cluster*, choose a @timestamp and Kibana is ready. You should see all the logs from all namespaces in your Kubernetes cluster. Rich Kubernetes metadata is there also, for example:
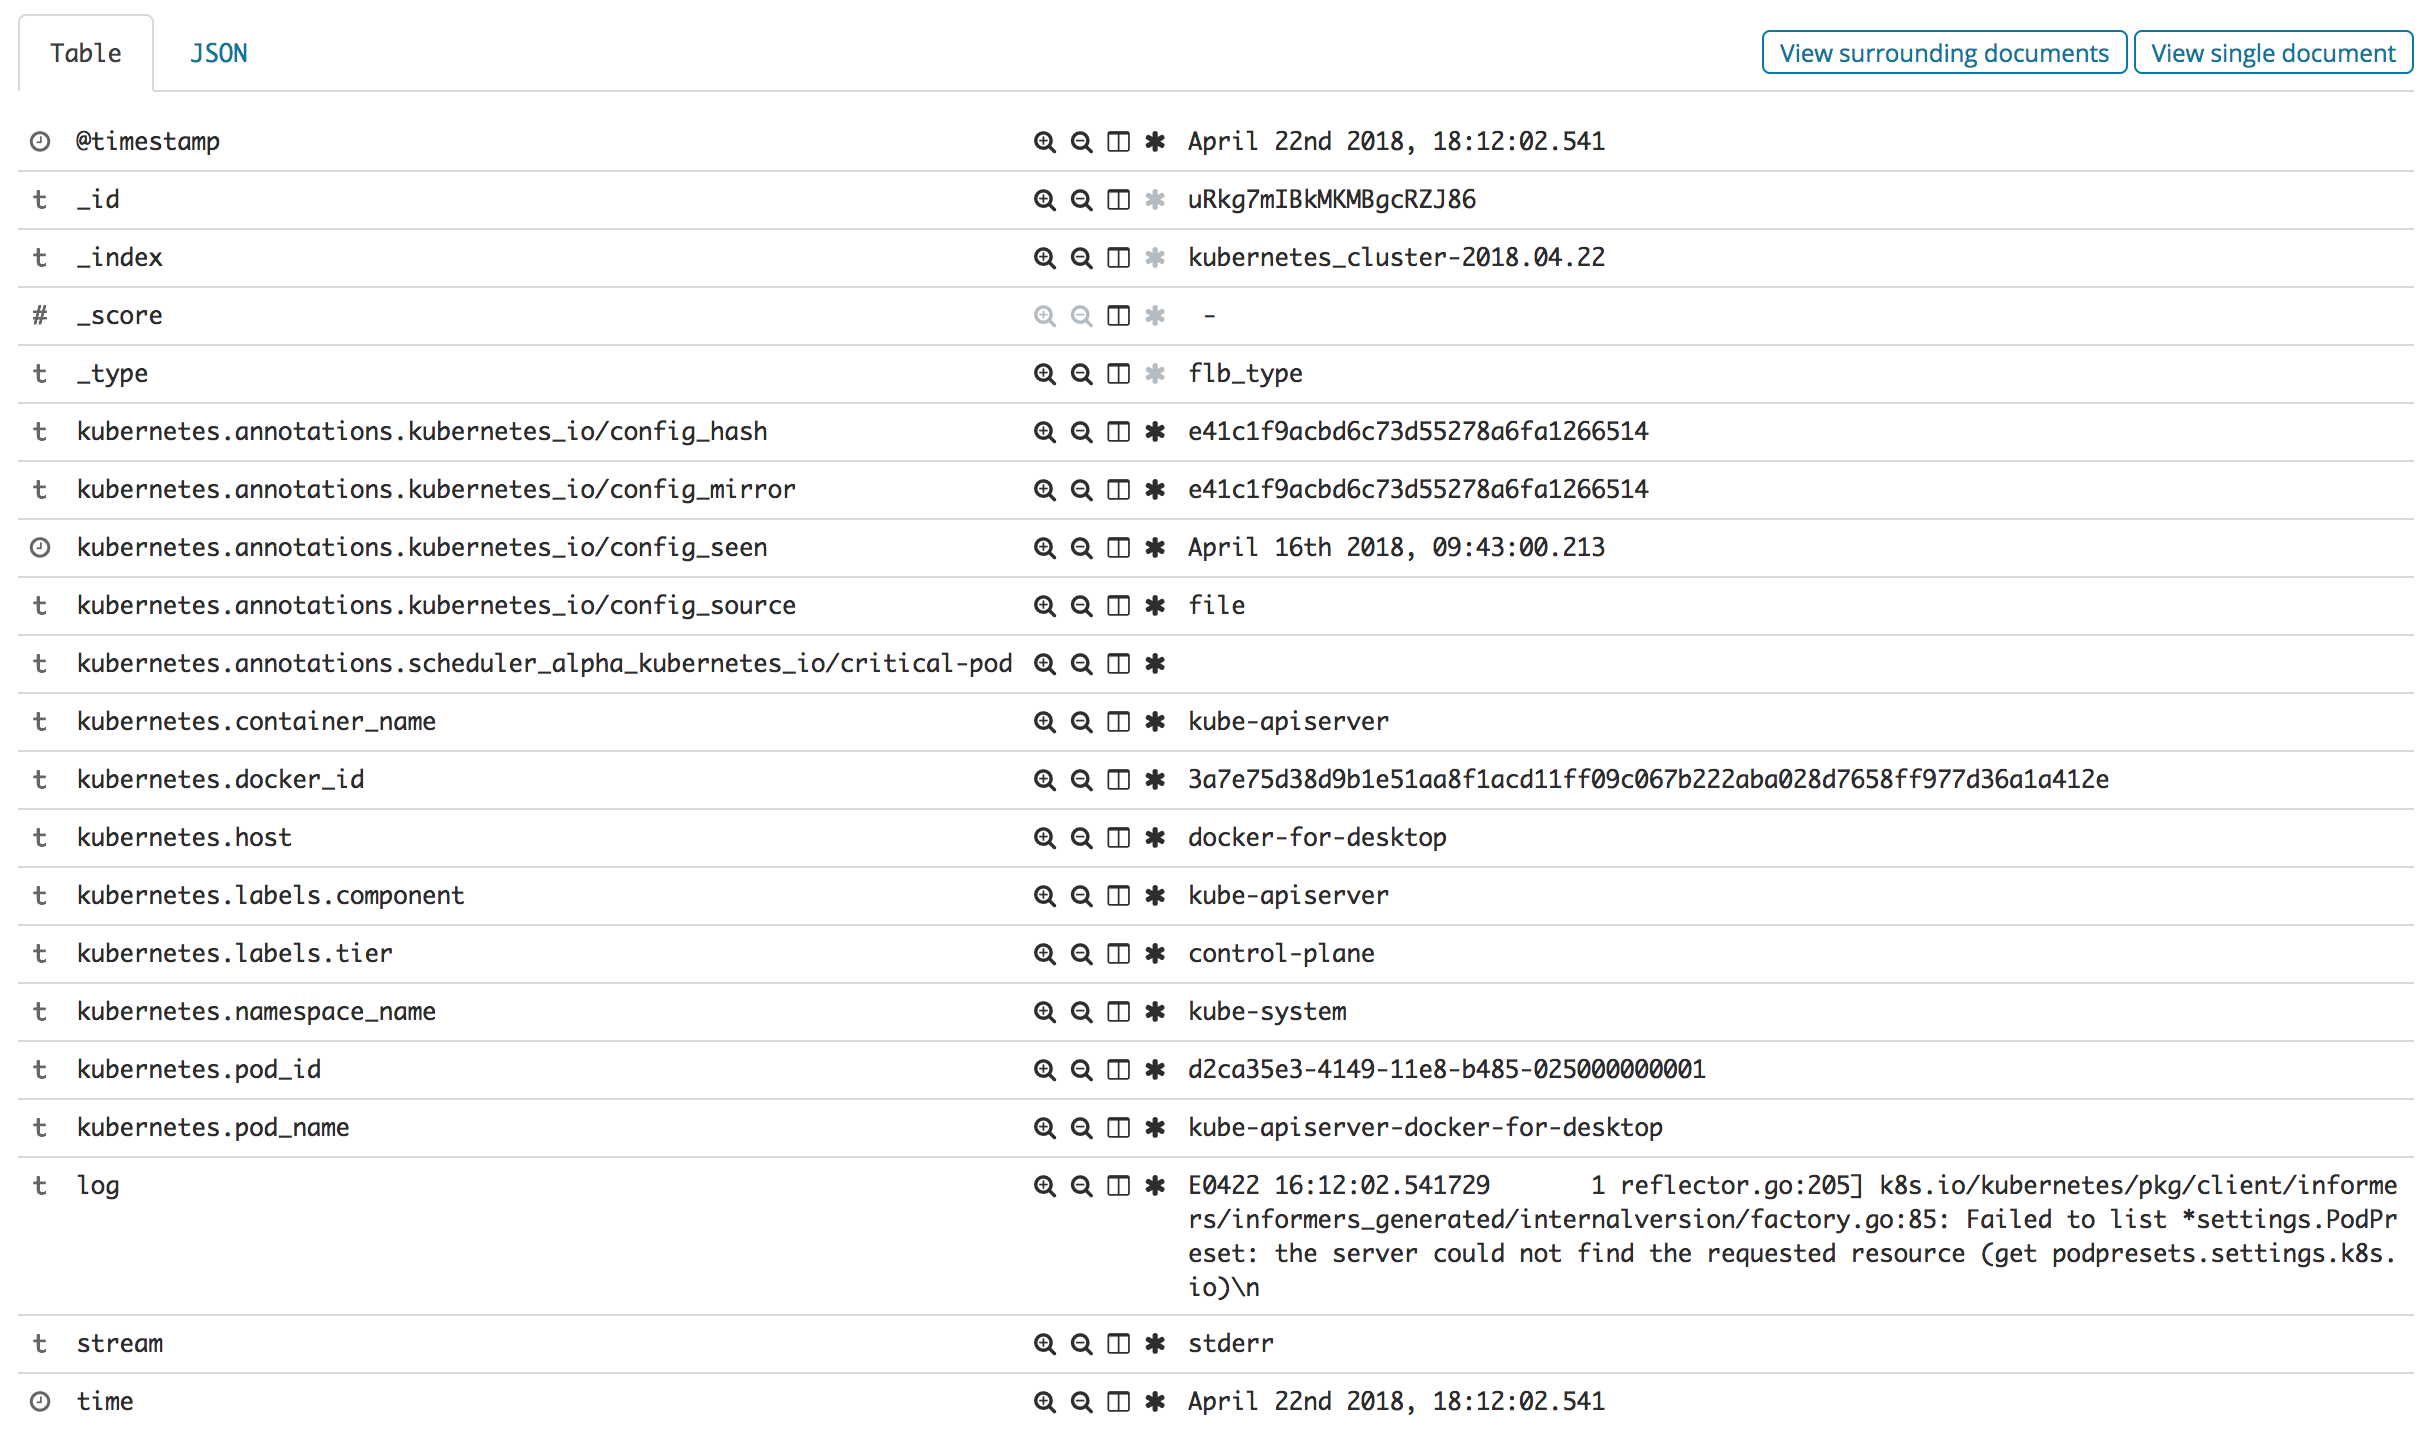
There you go, all Kubernetes logs in one place!
Summary
It is nice to see that metrics and logs monitoring is easy with Kubernetes. Of course, for each solution, some tweaks need to be done, but getting started was never so easy. Stay tuned for the next one.